Every FMCG brand talks about visibility. Few brands actually measure it in a way that changes decisions. Share of Shelf (SOS) ,the proportion of shelf space your products occupy relative to competitors within a category, is one of the strongest predictors of retail sales performance, yet it remains one of the most poorly tracked metrics in the industry. In this article, we look at why SOS deserves a seat at the top table of your retail KPIs, and what it actually takes to move the number.
Share of Shelf is a simple ratio: the linear or facing space your brand occupies divided by total category space in that outlet. But behind that simple number sits a web of factors: planogram compliance, facings per SKU, secondary displays, and how aggressively your merchandising team defends that space on every single visit. A brand that wins the shelf on Monday can lose it by Friday if a competitor’s rep restocks more aggressively or a store attendant reorganises a category.
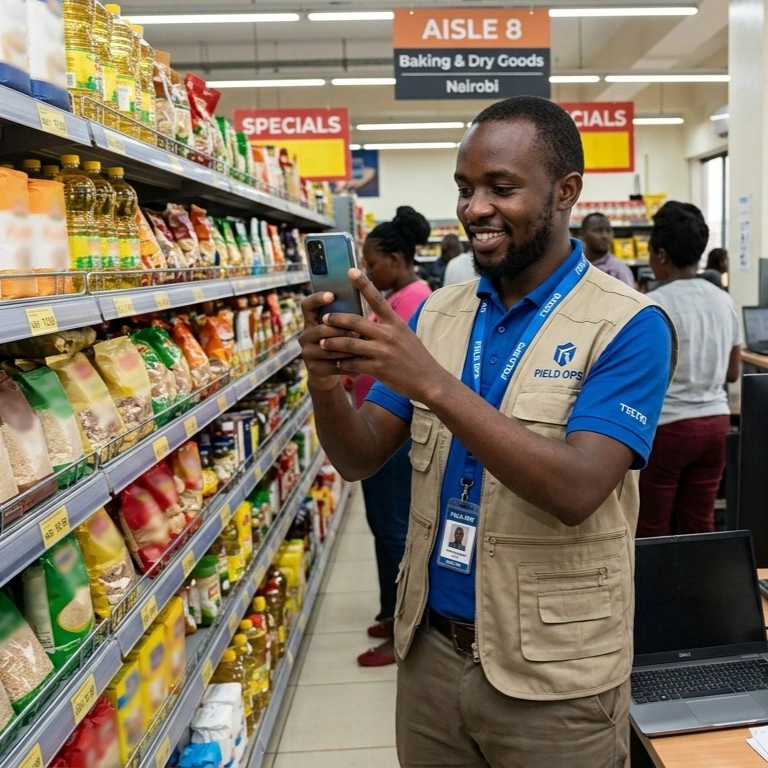
Category management research consistently links share of shelf to share of market; in many FMCG categories, gains in SOS correlate with measurable gains in offtake, particularly for impulse and low-consideration categories where the shopper decides at the shelf, not before entering the store. For brands running trade promotions, SOS is often the difference between a promotion that converts and one that simply subsidises volume that would have sold anyway.
Winning shelf space and keeping it are different disciplines. Winning it is a negotiation, built on relationships with store management, trade agreements and JBPs. Keeping it is operational; it depends on your field team’s rigor: are facings replenished at every visit, are out-of-stocks caught before they open a gap for a competitor, is your planogram enforced consistently across every outlet in your universe? At TopTouch, our merchandising teams are trained to treat every store visit as a mini shelf-defence exercise, not a stock check.
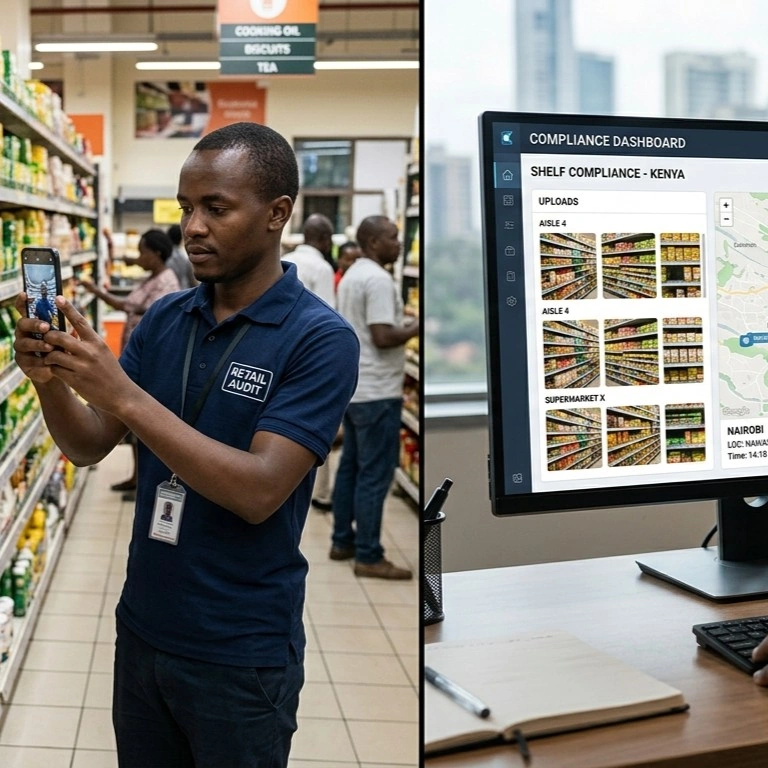
Our field teams capture photo-verified SOS data at every outlet visit, feeding directly into our analytics dashboard. This gives brand managers a live, geography-by-geography view of exactly where they are winning and losing the shelf, and against which competitors, rather than a quarterly snapshot that is already out of date by the time it lands in an inbox.
The brands that get the most value from SOS tracking don’t just monitor it; they use it. Consistent, well-documented SOS data becomes powerful evidence in trade negotiations, JBP reviews and category management conversations, giving brand teams the receipts to argue for more space, better positioning or renewed trade terms.